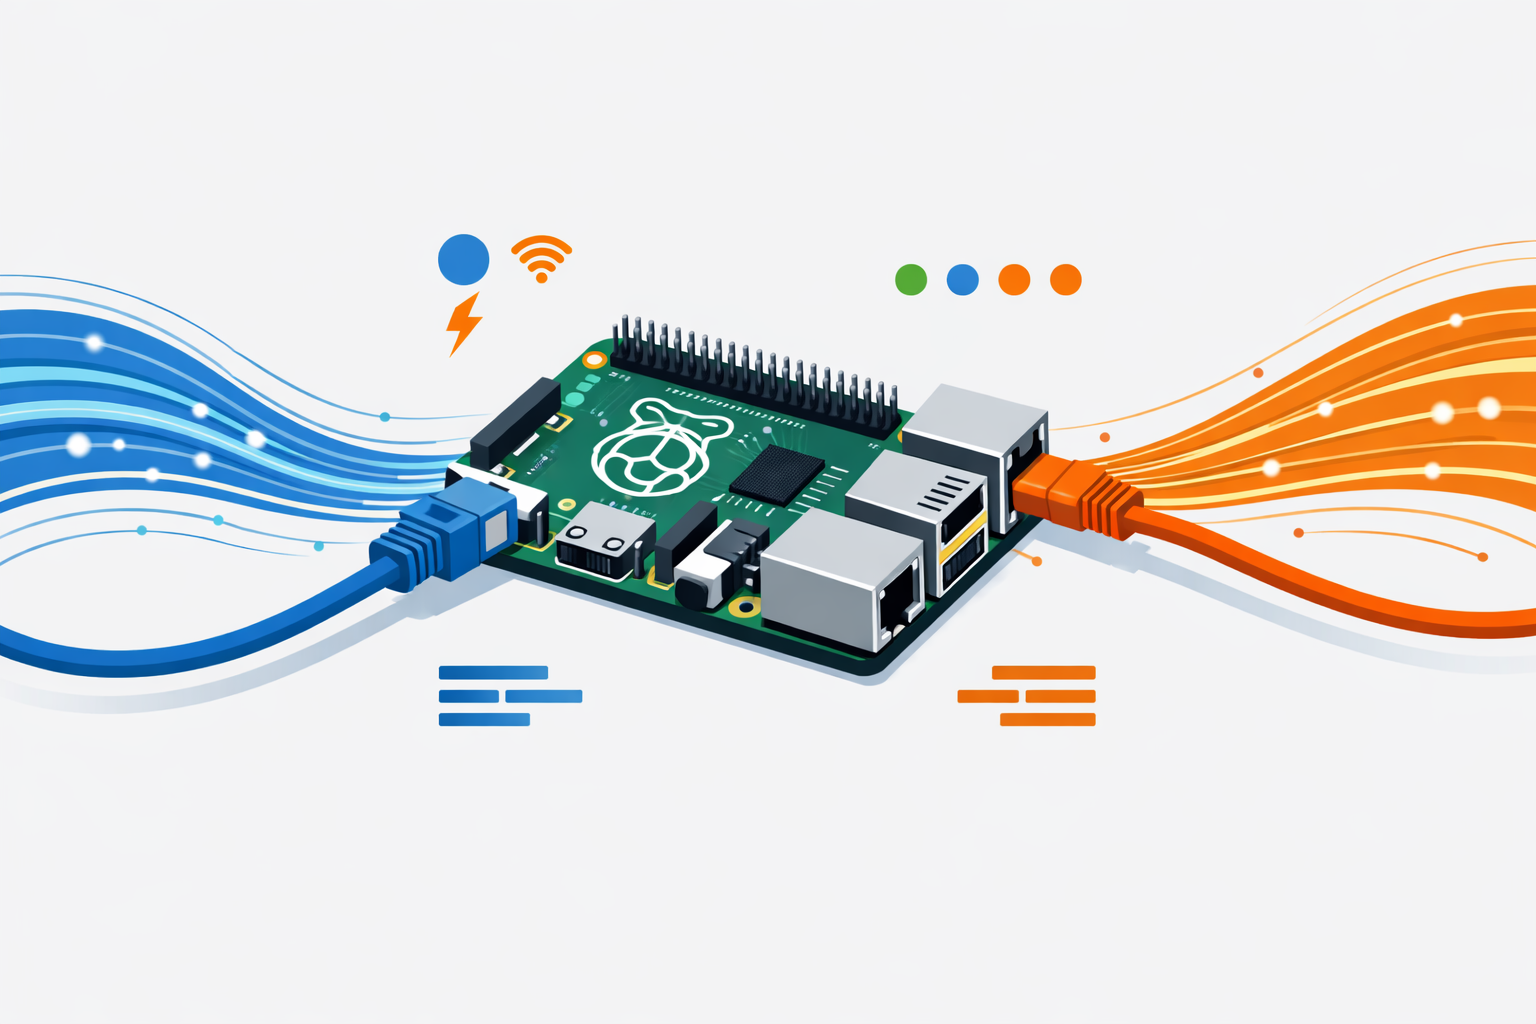
Building a Home Infrastructure API with Node-RED
How I built a lightweight monitoring endpoint for my Raspberry Pi and home servers
—
Every home lab needs a heartbeat. Something that quietly reports: “I’m here, I’m healthy, here’s what’s happening.”
For me, that heartbeat is a simple JSON endpoint running on Node-RED: http://192.168.50.2:1880/api/status
It returns temperature, RAM usage, and disk space for all my devices. My OpenClaw assistant polls it every few hours. If something’s wrong, I know.
Here’s how I built it.
—
Why Node-RED?
I already use Node-RED for home automation — lights, sensors, notifications. Adding an API endpoint was trivial. No new services. No extra containers. Just a few nodes and a function block.
The result? A single URL that aggregates health data from multiple machines.
—
The Architecture
┌─────────────┐     ┌─────────────┐     ┌─────────────┐
│  Raspberry  │     │   Node-RED  │     │   Client    │
│     Pi      │◄────│   (hub)     │◄────│  (OpenClaw) │
│  (device)   │     │  (API agg)  │     │  (consumer) │
└─────────────┘     └─────────────┘     └─────────────┘
       ▲                                    │
       │            ┌─────────────┐        │
       └────────────┤  Synology   │◄───────┘
                    │    NAS      │
                    └─────────────┘
Node-RED runs on my “hub” Pi. It collects data from itself, my Synology NAS, and any VMs that report in. The client (OpenClaw) hits one endpoint and gets everything.
—
The Flow: Step by Step
1. HTTP In Node
Create an HTTP endpoint:
– Method: GET
– URL: /api/status
This creates the route. When something hits http://your-pi:1880/api/status, this flow triggers.
2. Function Node: Gather Local Data
// Get local system stats
const os = global.get('os');
const fs = global.get('fs');

const totalMem = os.totalmem();
const freeMem = os.freemem();
const usedMem = totalMem - freeMem;
const ramPercent = Math.round((usedMem / totalMem) * 100);

// Read CPU temp (Raspberry Pi specific)
let cpuTemp = null;
try {
    const tempRaw = fs.readFileSync('/sys/class/thermal/thermal_zone0/temp', 'utf8');
    cpuTemp = parseInt(tempRaw) / 1000;
} catch (e) {
    cpuTemp = null;
}

// Disk usage
try {
    const disk = execSync("df -m / | tail -1 | awk '{print $2,$3}'").toString().trim().split(' ');
    msg.payload = {
        id: 'hub',
        time: new Date().toISOString(),
        cputemp: cpuTemp,
        ram: {
            total: Math.round(totalMem / 1024),
            used: Math.round(usedMem / 1024),
            p: ramPercent + '%',
            unit: 'k'
        },
        disk: {
            sd: {
                total: parseInt(disk[0]),
                used: parseInt(disk[1]),
                p: Math.round((disk[1]/disk[0])*100) + '%',
                path: '/',
                unit: 'm'
            }
        }
    };
} catch (e) {
    msg.payload = { error: 'disk check failed' };
}

return msg;
This grabs:
– CPU temperature (Raspberry Pi thermal zone)
– RAM usage (total, used, percentage)
– Disk usage (root partition)
3. HTTP Request Nodes: Poll Remote Devices
For my Synology NAS and VMs, I add HTTP Request nodes that hit their respective health endpoints (if they expose them) or use SSH/exec nodes to run remote commands.
4. Join Node: Combine Everything
Use a join node to wait for all data sources, then combine into a single response.
5. HTTP Response Node
Send it back:
msg.statusCode = 200;
msg.headers = { "Content-Type": "application/json" };
return msg;
—
Sample Output
{
  "total": 3,
  "rows": [
    {
      "id": "hub",
      "time": "2026-03-23T18:56:54.774Z",
      "cputemp": 53.5,
      "ram": { "total": 1893600, "used": 992564, "p": "52%", "unit": "k" },
      "disk": { "sd": { "total": 28790, "used": 21218, "p": "77%", "path": "/", "unit": "m" } }
    },
    {
      "id": "ocean-sm-01",
      "time": "2026-03-23T18:55:01.000Z",
      "ram": { "total": 465076, "used": 281512, "p": "60%", "unit": "k" },
      "disk": { "hard": { "total": 9741, "used": 4741, "p": "49%", "path": "/", "unit": "m" } }
    }
  ]
}
Clean. Structured. Easy to parse.
—
Consuming the API
From OpenClaw, a simple curl gives me everything:
Check current status
curl -s http://192.168.50.2:1880/api/status | jq .

Alert if CPU temp > 65°C
curl -s http://192.168.50.2:1880/api/status | \
  jq -r '.rows[] | select(.cputemp > 65) | "WARNING: \(.id) at \(.cputemp)°C"'

Check disk space
curl -s http://192.168.50.2:1880/api/status | \
  jq -r '.rows[].disk | values | .[] | select(.p | tonumber > 80) | "Disk at \(.p) on \(.path)"'
I run these in scheduled health checks. If anything’s off, I get a Telegram message.
—
Why This Approach Works
Decentralized collection: Each device reports what it knows. Node-RED aggregates. The consumer (OpenClaw) doesn’t need to know how to SSH into a Synology or read Pi thermal zones.
Language agnostic: JSON over HTTP. Query it from curl, Python, a browser, whatever.
Extensible: Add new devices by adding new data sources to the flow. The response format stays consistent.
Lightweight: Node-RED is already running. This adds minimal overhead.
—
Deployment Tips
1. Enable authentication if exposing externally (or keep it internal-only)
2. Set CORS headers if accessing from web apps
3. Cache aggressively — no need to poll disks every second
4. Version your API — /api/v1/status leaves room for /api/v2/
—
The Result
I now have a single URL that tells me the health of my entire home infrastructure. My AI assistant checks it automatically. I check it manually when something feels off.
It’s not fancy. It’s not distributed tracing with Jaeger. But it works, it’s reliable, and I understand every piece of it.
Sometimes the simple solution is the right one.
—
Resources
– Node-RED — Low-code event-driven automation
– jq — Command-line JSON processor
– OpenClaw — Self-hosted AI agent framework
—
What does your home lab monitoring look like? Simple scripts, Prometheus/Grafana, or something else entirely?