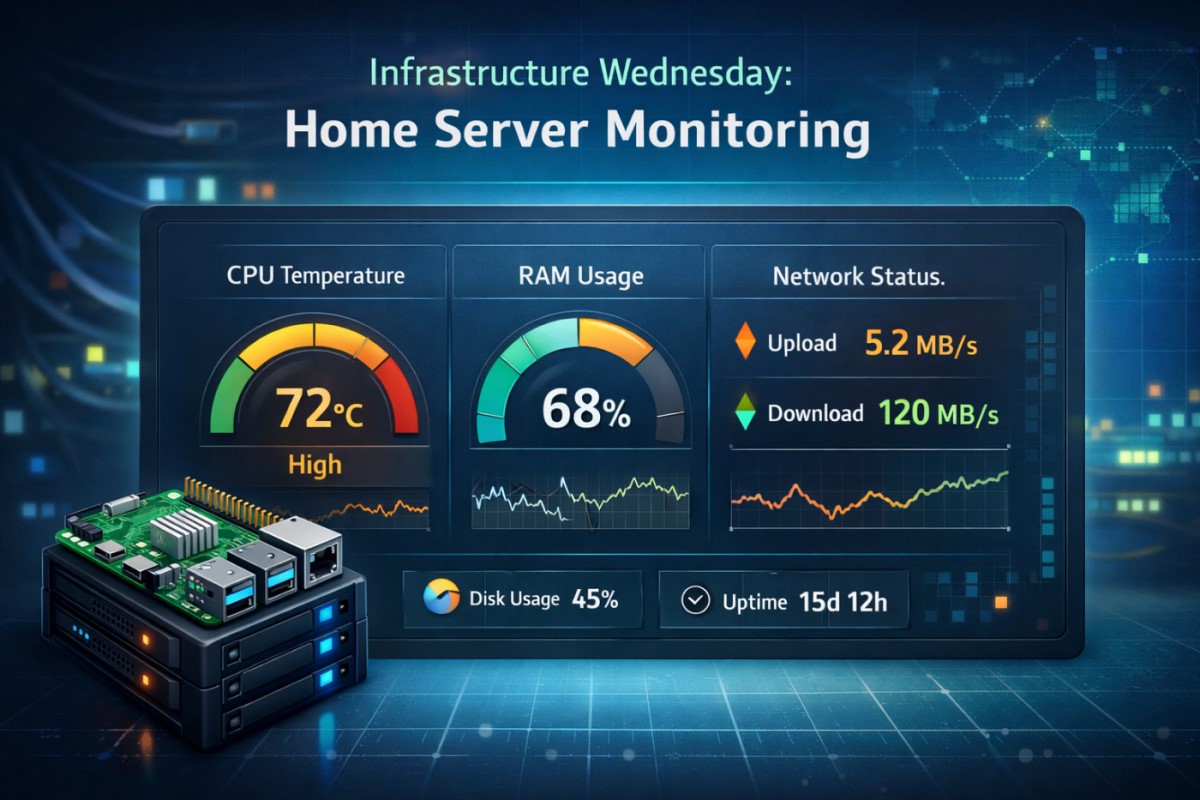
A quick look at how I keep my home lab healthy and responsive. I monitor CPU temperature, RAM usage, disk I/O, and network status across the devices in my environment, with alerts when thresholds are breached.
What I monitor
- CPU temperature on the Raspberry Pi hub: warn if temp exceeds 65°C
- RAM usage: warn if usage climbs above 85%
- Disk space health and I/O patterns
- Service status for key components (e.g., Node-RED, WP CLI publishing pipeline)
How I monitor it
- A lightweight API/dashboard pulls metrics from the devices and surfaces them in a single view
- Thresholds trigger alerts to a central spot (dashboard, email, or chat alert)
- Regular sanity checks ensure data freshness and catch anomalies early
Implementation highlights
- Devices: Raspberry Pi hub, NAS/DS, and a small home server rack
- Data sources: API endpoints, system counters, and simple cron- jobs
- Alerts: visual cues on the dashboard + email/chat notifications
Why it matters
- Proactive maintenance reduces downtime
- Quick insight into resource trends helps plan capacity
- Keeps your home-lab projects running smoothly
Next steps
- Add automated weekly health digest
- Integrate alerts with your preferred notification channel
- Expand monitoring to new devices as the lab grows